Sustainability has three pillars — environmental, economic and social — and hardly anyone measures the social one, because the serious databases are all paid. So I built a free one, using a public standard (UNEP 2020) and open data, and tested it on a cup of coffee: the same coffee, four origins. The result makes marketing uncomfortable.
Medium risk hours (mrh) per 1 kg of roasted coffee. An indicative index; the real result is the breakdown by subcategory.
We talk about carbon and water footprints. But products are made by people, and measuring that — S-LCA — requires paid databases that hardly anyone has. This case shows that the standard is public and so is the data: it can be built for free.
More than 99.9% of the social risk lies in growing the beans, not in roasting here. Like carbon, the impact lives three links upstream.
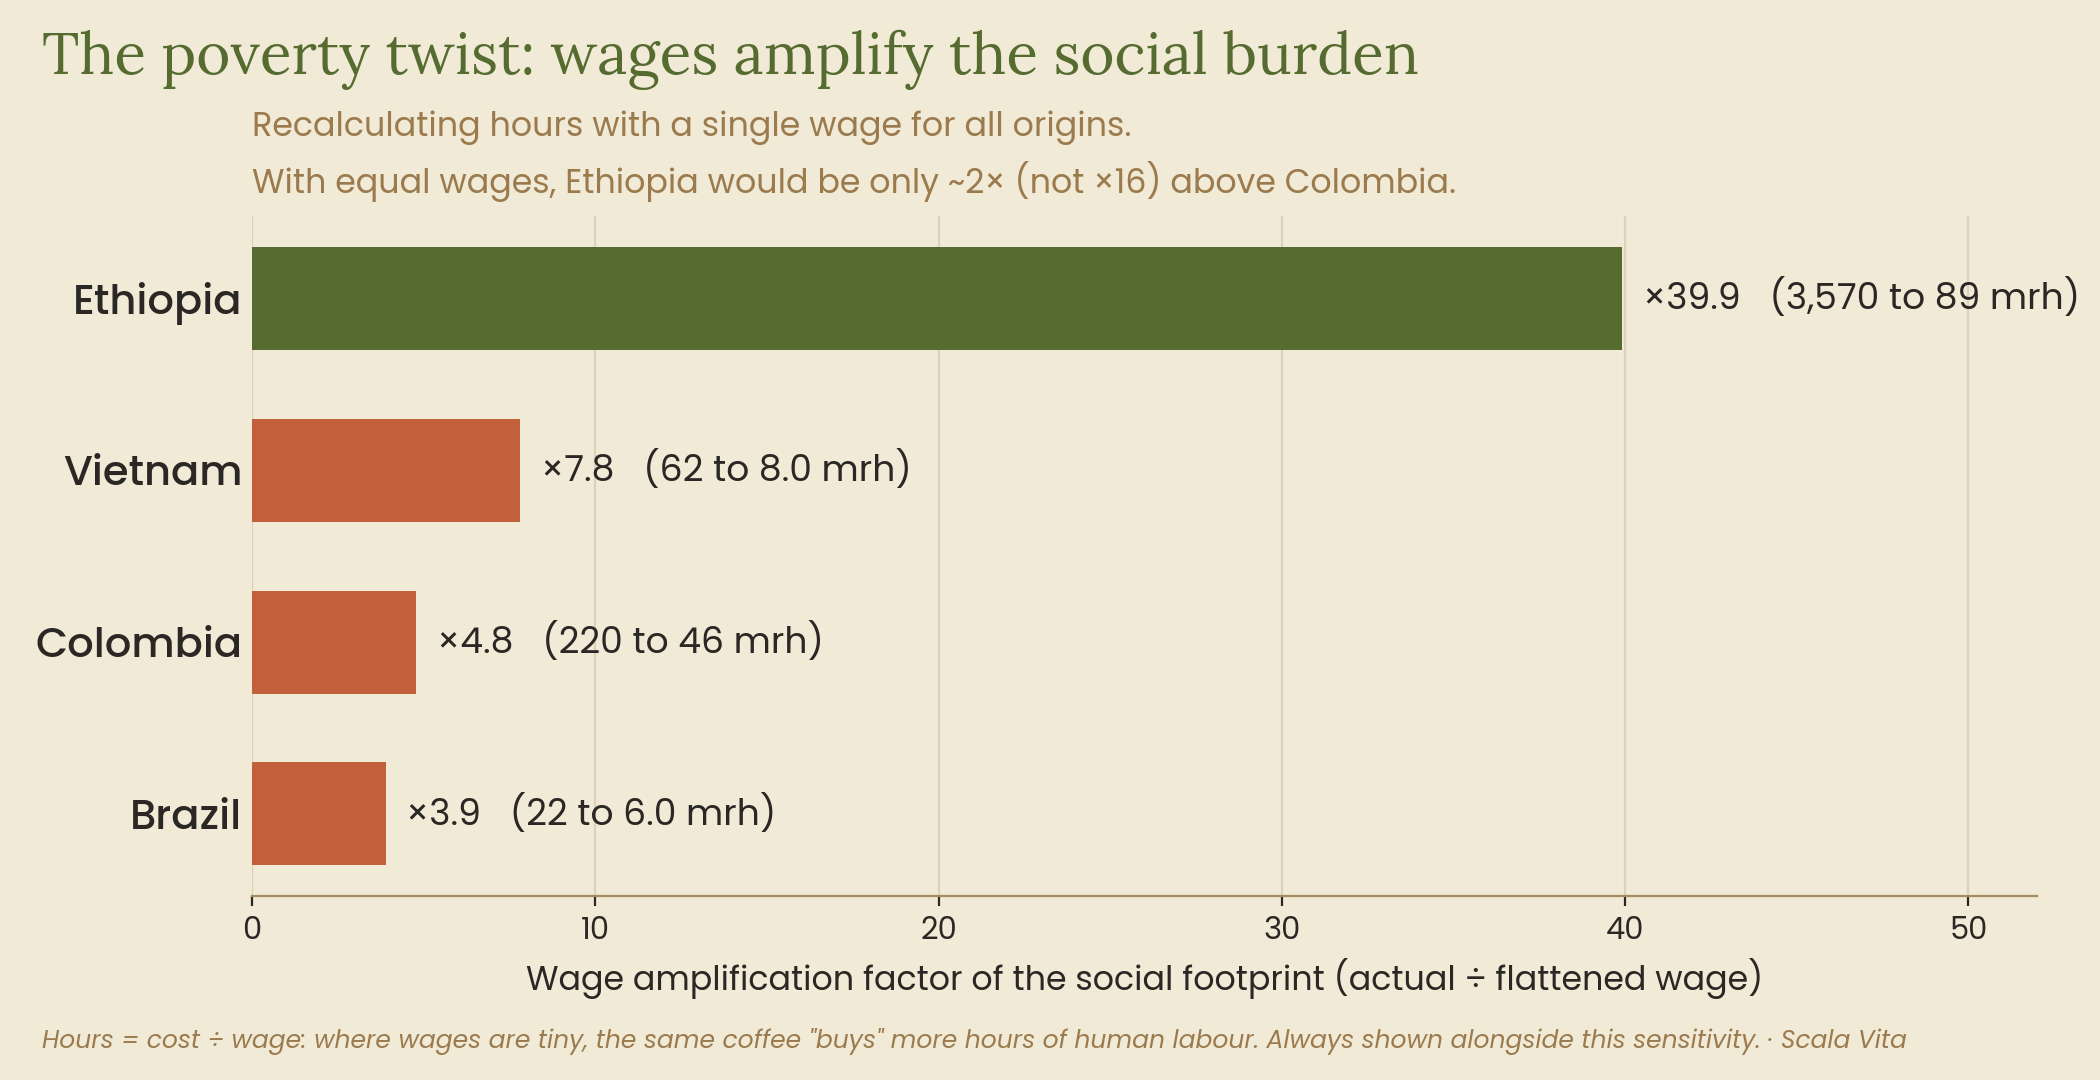
Hours are measured as cost ÷ wage: where wages are tiny, the same coffee "buys" more hours of human labour. It has to be read with care.
Not the "artisanal", not the "certified", not the "industrial": each origin has its own hotspot. The single number depends on the weighting.
Two companies want to measure their social impact — the CSRD asks for it, their customer asks for it, their brand story asks for it. One pays thousands of euros for a PSILCA licence. The other can't. Is the second one left measuring nothing?
And about the cup: buying the same coffee, which origin carries the most social risk per kilo, and why isn't the "cheap" or the "artisanal" one automatically the "clean" one?
How it was doneThe method — the same one PSILCA uses — has three steps. First, the working hours embedded in each link are estimated (hours = cost ÷ wage). Then each public data point is compared against a threshold rubric and assigned a risk level. And each level is multiplied by an exponential factor to give the result in medium risk hours (mrh), a comparable figure that makes the hotspots stand out.
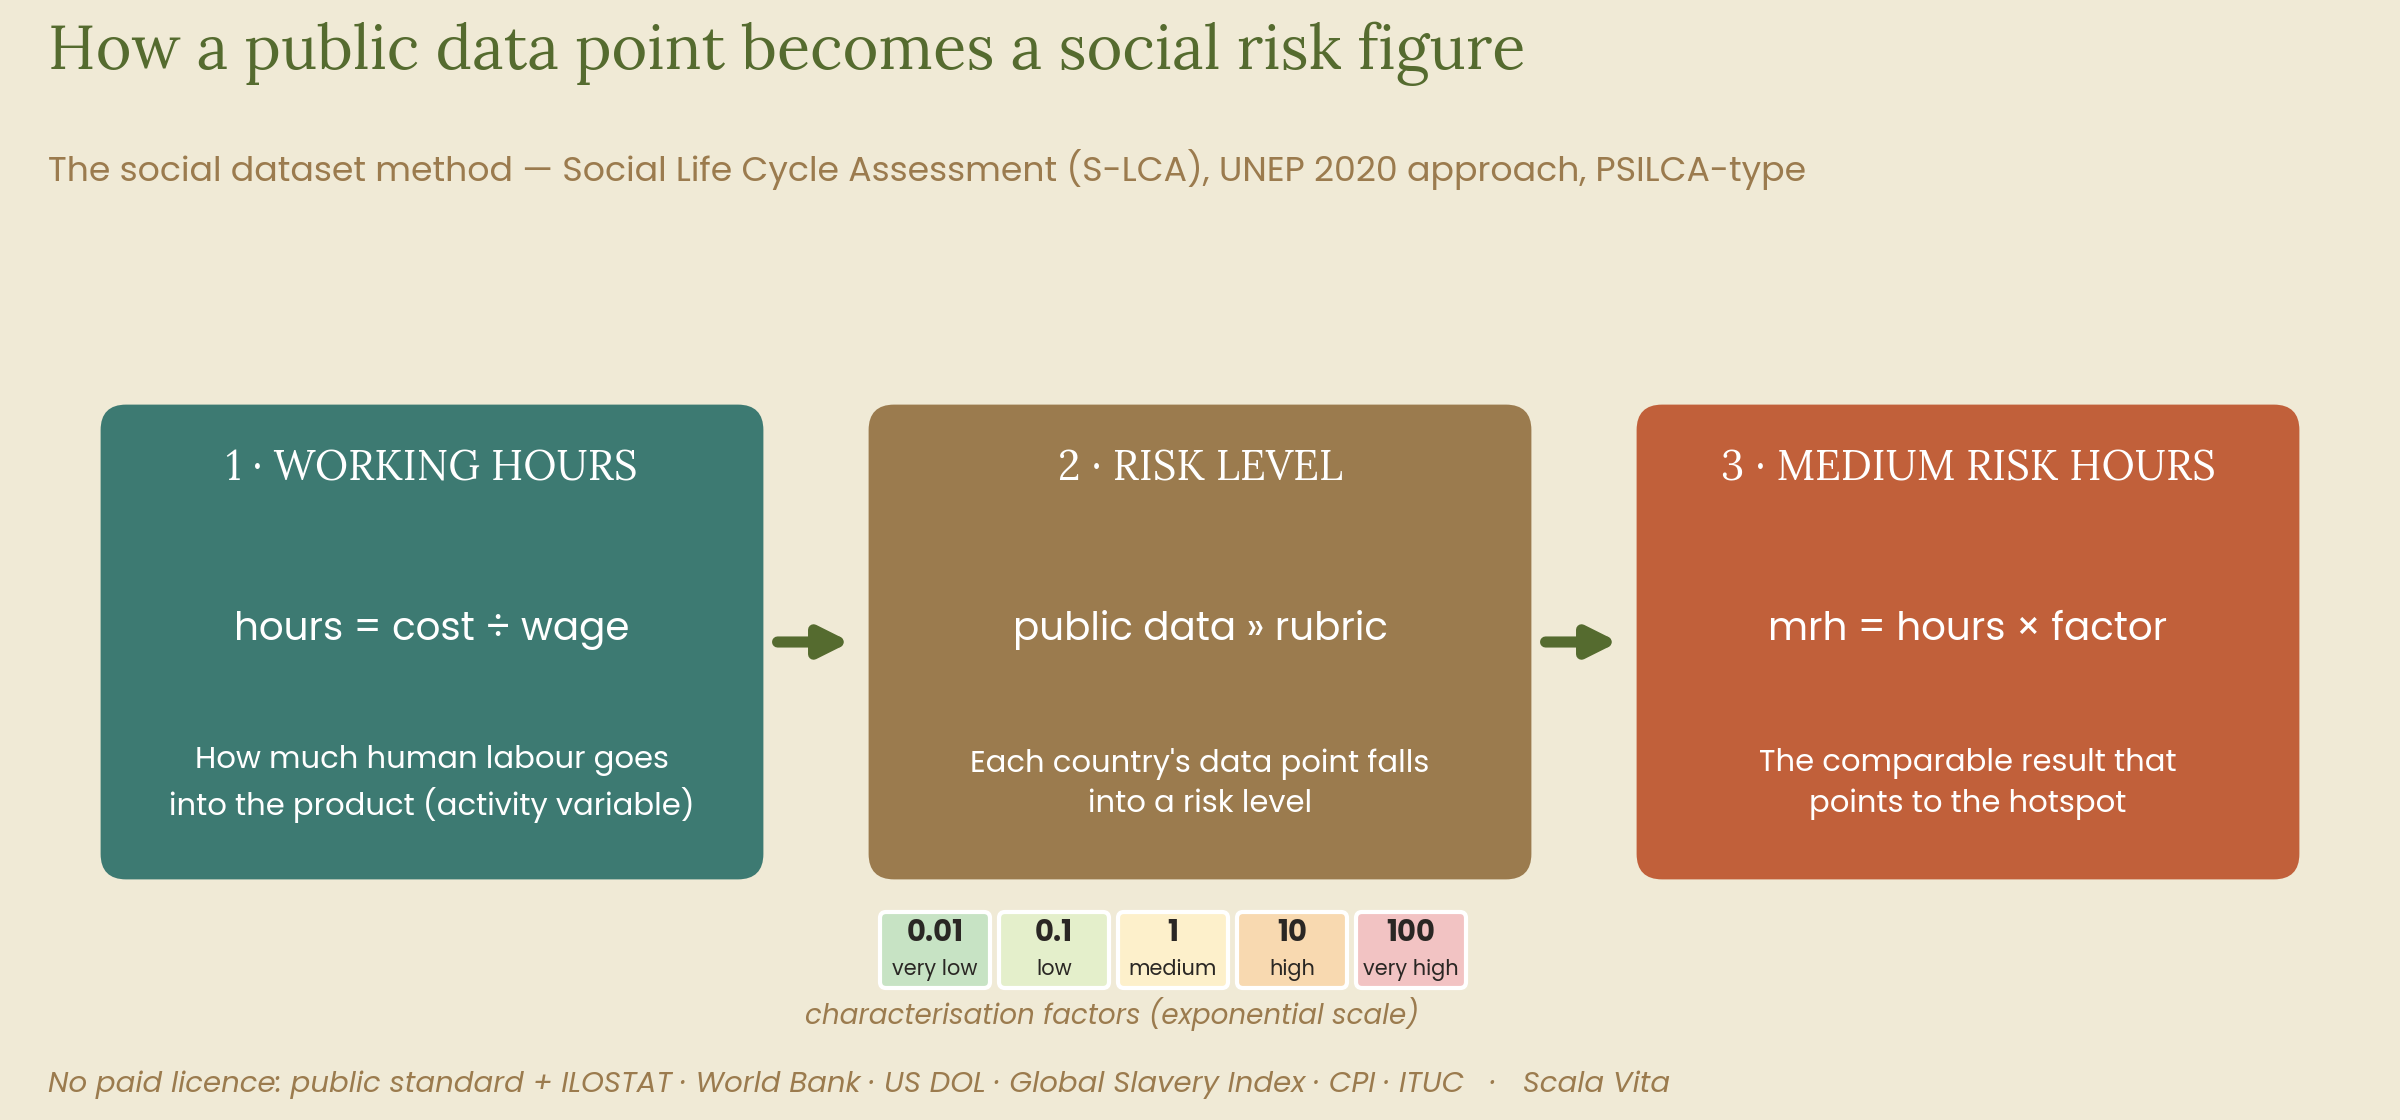
The dataset covers nine subcategories from the UNEP Guidelines — six for Workers (fair wage, working hours, child labour, forced labour, health and safety, freedom of association) and three for Society (corruption, economic development, conflicts) — using public sources: ILOSTAT, the World Bank, the US DOL child and forced labour lists, the Global Slavery Index, Transparency International and the ITUC.
Applied to 1 kg of roasted coffee, the result is unequivocal: the coffee associated with an "artisanal smallholder" story (Ethiopia) comes out with the highest social risk, and the "certified" one (Colombia) second. Brand intuition points the opposite way to the data. Ethiopia saturates wages, child labour, forced labour and development; Colombia concentrates its risk in forced labour and freedom of association.
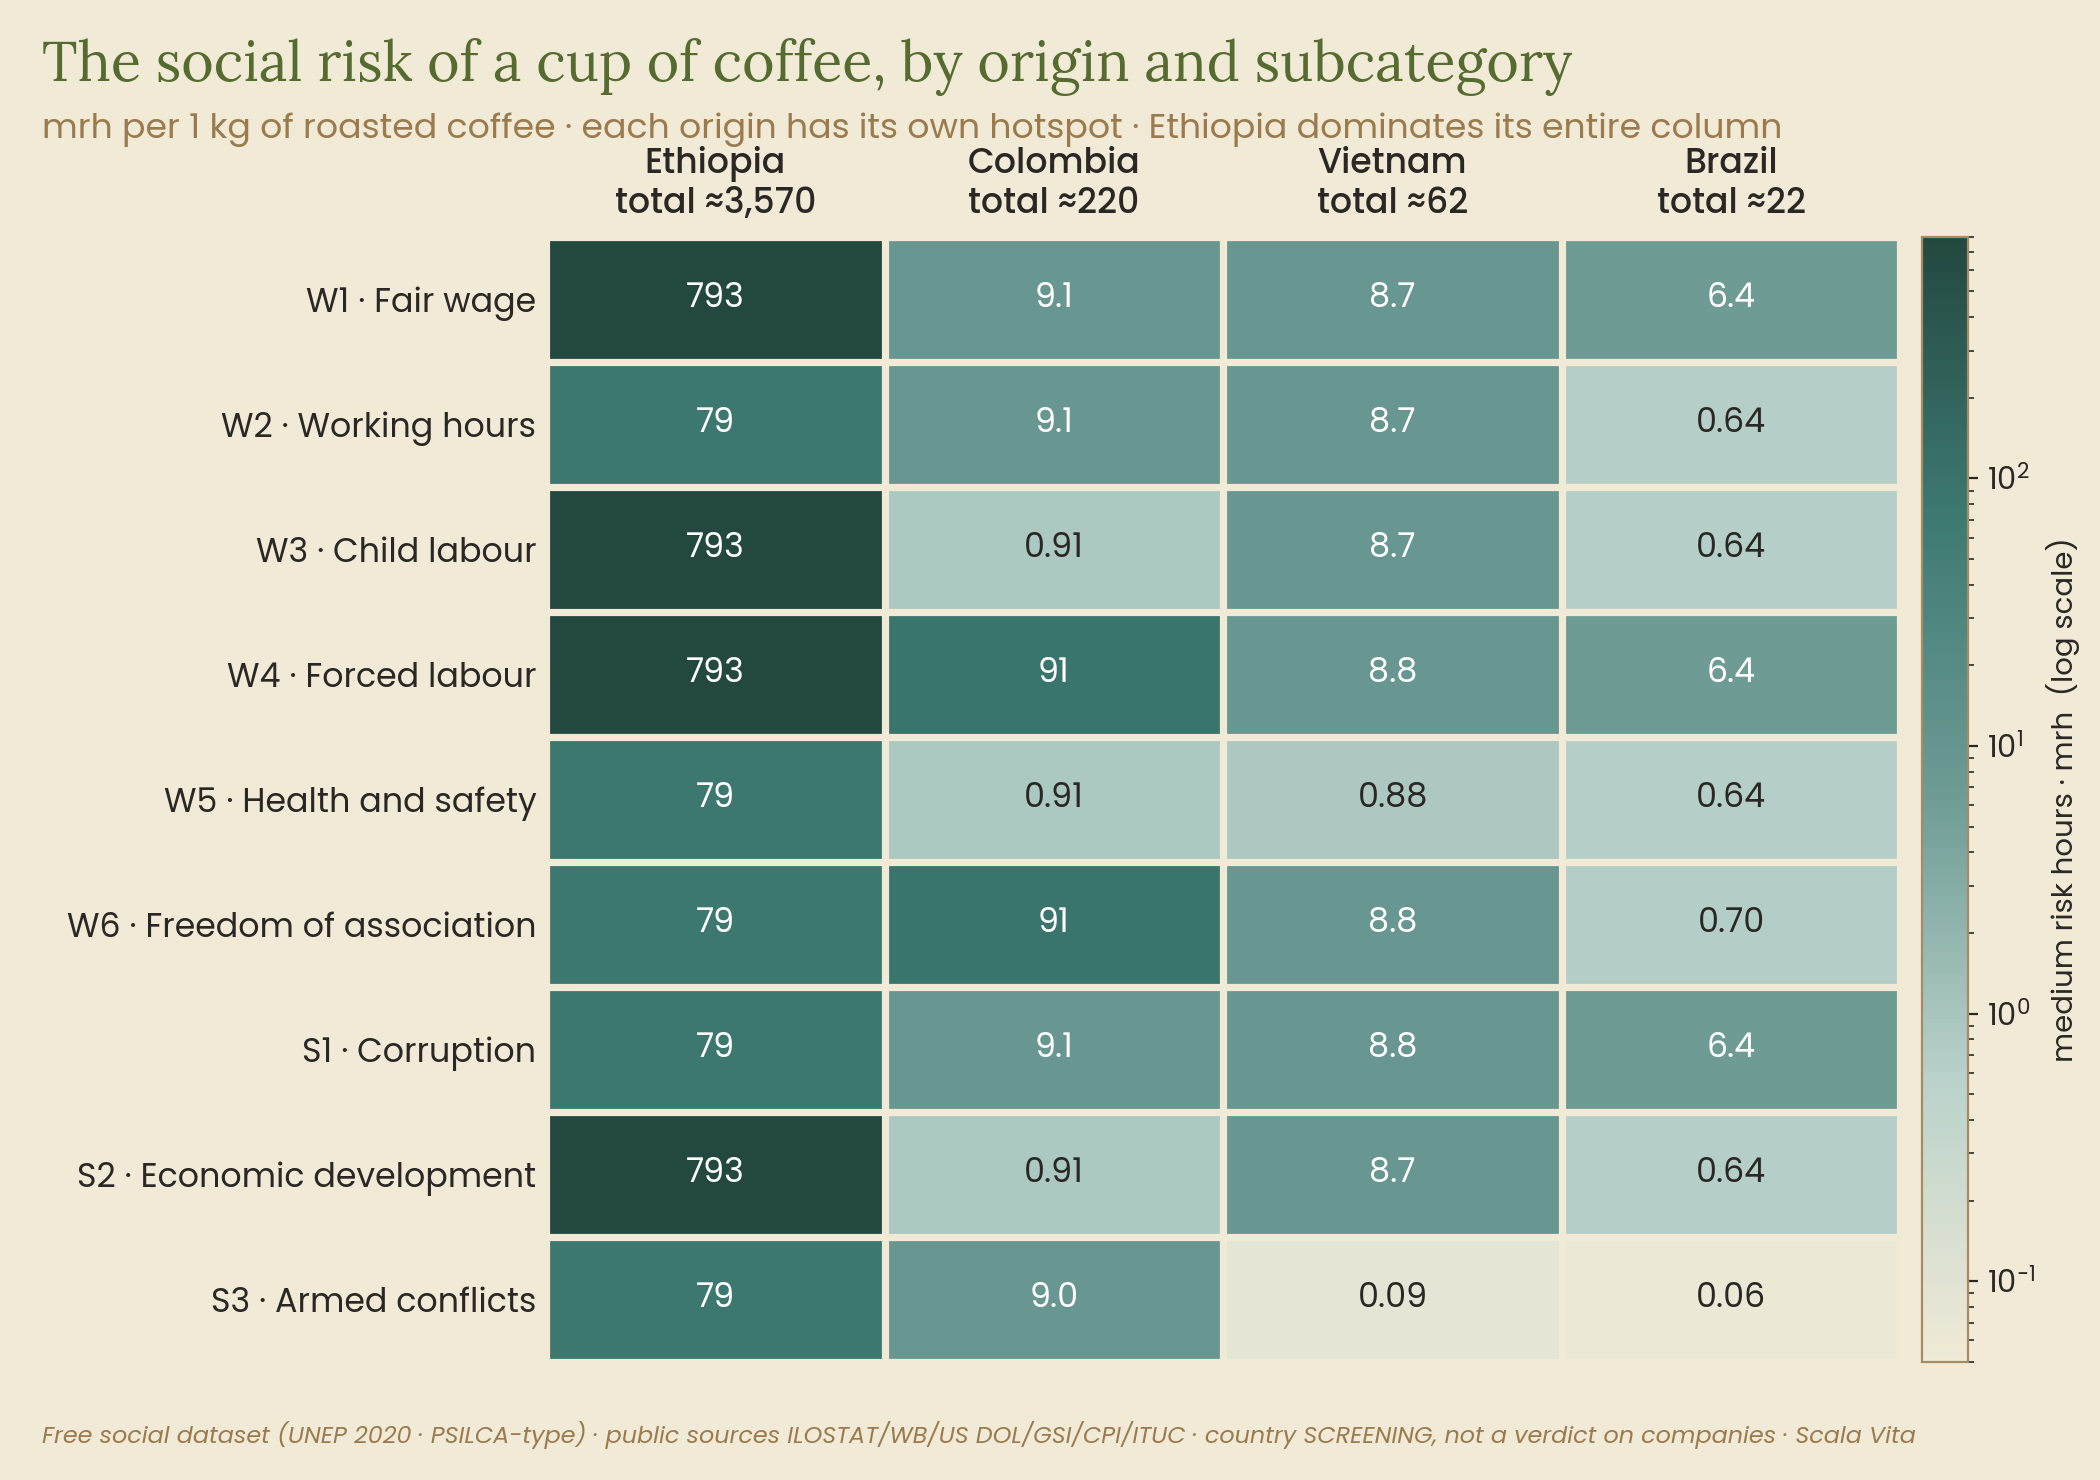
| Subcategory | Ethiopia | Colombia | Vietnam | Brazil |
|---|---|---|---|---|
| Fair wage | 793 | 9.1 | 8.7 | 6.4 |
| Child labour | 793 | 0.9 | 8.7 | 0.6 |
| Forced labour | 793 | 91 | 8.8 | 6.4 |
| Freedom of association | 79 | 91 | 8.8 | 0.7 |
| Economic development | 793 | 0.9 | 8.7 | 0.6 |
| Total (indicative index) | 3,570 | 220 | 62 | 22 |
The total is an indicative index (equally weighted sum); the result that matters is the breakdown by subcategory. More than 99.9% of the risk comes from growing the beans; roasting in Spain contributes almost nothing. The lever for social improvement is in sourcing, not in your own operations.
The most important point isn't the ranking, but understanding the method. Because labour is measured in hours = cost ÷ wage, where wages are tiny the same coffee embeds many more hours. Isolating that effect — recalculating with a single wage for all origins — Ethiopia's footprint is amplified almost ×40 by its low wages. S-LCA doesn't say "don't buy from the poor": it says where to look and what to improve.
Adding nine subcategories into one index forces you to decide how much each one weighs, and that's a value judgement. If child and forced labour are prioritised (×3), Ethiopia and Colombia pull even further ahead; with products of similar risk, a change in weights can flip the ranking. That's why the main result is the breakdown by subcategory; the single number is shown separately, with its weighting declared.
| Origin | Equal-weight index | Prioritising child + forced labour (×3) |
|---|---|---|
| Ethiopia | 3,570 | 6,744 (×1.89) |
| Colombia | 220 | 403 (×1.83) |
| Vietnam | 62 | 97 (×1.56) |
| Brazil | 22 | 37 (×1.63) |
And a word of warning on use: the dataset is a compass, not a GPS. It tells you where to look (which country-sector concentrates risk), not who is to blame: a specific farm can be exemplary or abusive within the same country. Confusing country risk with supplier guilt is unfair and technically wrong.
The equally weighted "total" is indicative: weighting changes the ranking, which is why the real result is the breakdown. The dataset is a free, traceable alternative to PSILCA, not a certified substitute. It's for prioritising and for the social block of the CSRD, not for pointing fingers at countries.
An "artisanal" story doesn't guarantee low social risk. Measure your chain before you communicate it, especially your sourcing.
The "S" can be quantified too. This method covers the social block with public, traceable data and no paid licence.
99.9% of the risk is upstream: the lever is your supplier policy, not your plant.
Be careful with "ethical coffee" without data behind it. The number depends on the weighting: show it.
The social standards require data on own workers, value-chain workers and affected communities. This method covers that block with public, traceable sources.
Requires large companies to identify and mitigate adverse social impacts in their chain. Screening by origin is the first step: knowing where to look.
It will ban products made with forced labour from the EU market. Forced labour risk by origin — Ethiopia, Colombia — is exactly what needs watching.
Requires geolocated traceability of the beans. That same origin traceability enables social screening by country-sector.
This case uses an in-house dataset built on public data. Your product deserves its own social analysis — traceable and ready for the social block of the CSRD.