I took the same carbonated soft drink in its three real market containers — PET bottle, glass bottle and aluminium can — and used an LCA to calculate what it takes to make each one. The result runs against intuition. And the big finding isn't the ranking: it's that a container's footprint depends less on the material and more on three design decisions a manufacturer actually controls.
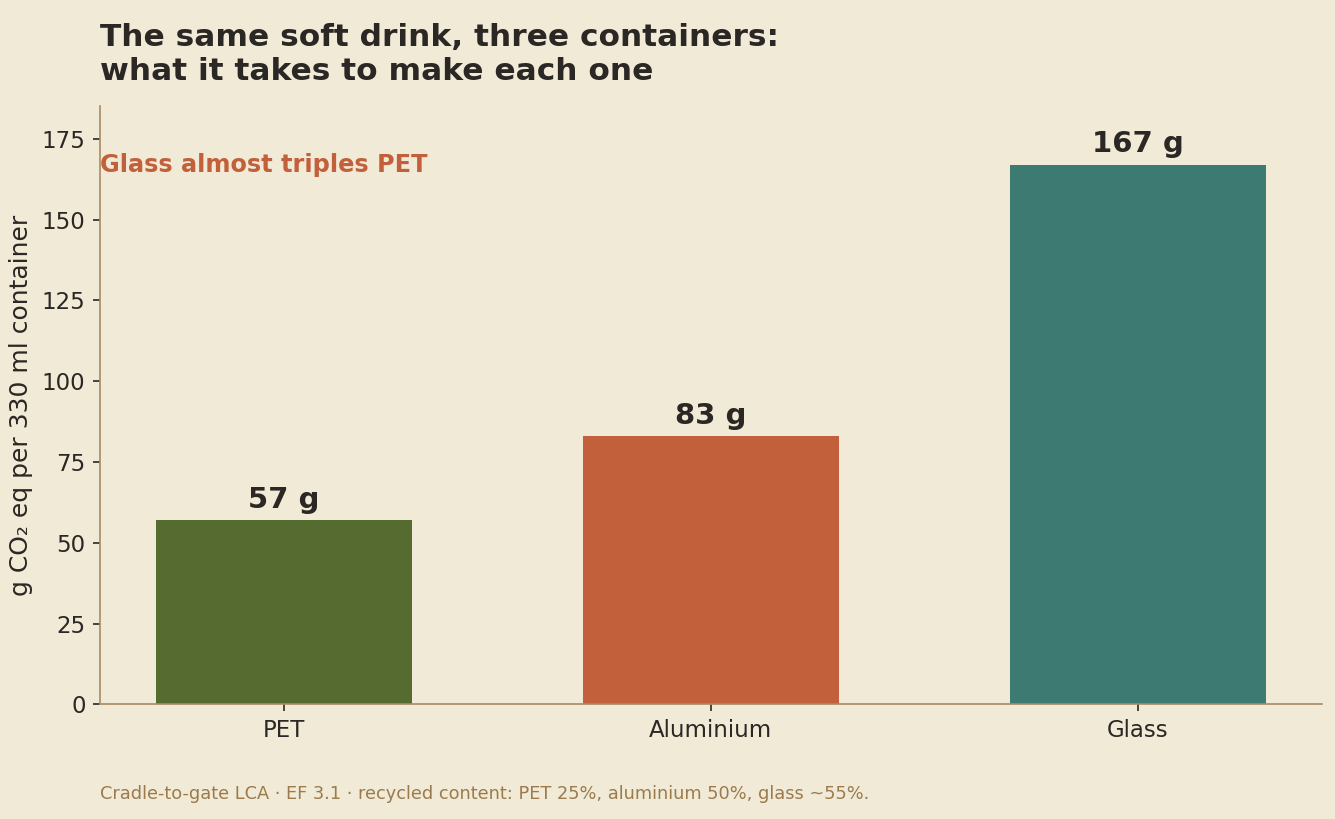
g CO₂ eq to manufacture the container for 330 ml. Manufacturing of the empty container only.
The container we associate with "natural" — glass — is the worst at the manufacturing stage, by a long way. But the interesting part starts after the ranking.
167 g versus 57 g per container. Glass weighs 10 times more and its melting furnace burns an enormous amount of energy.
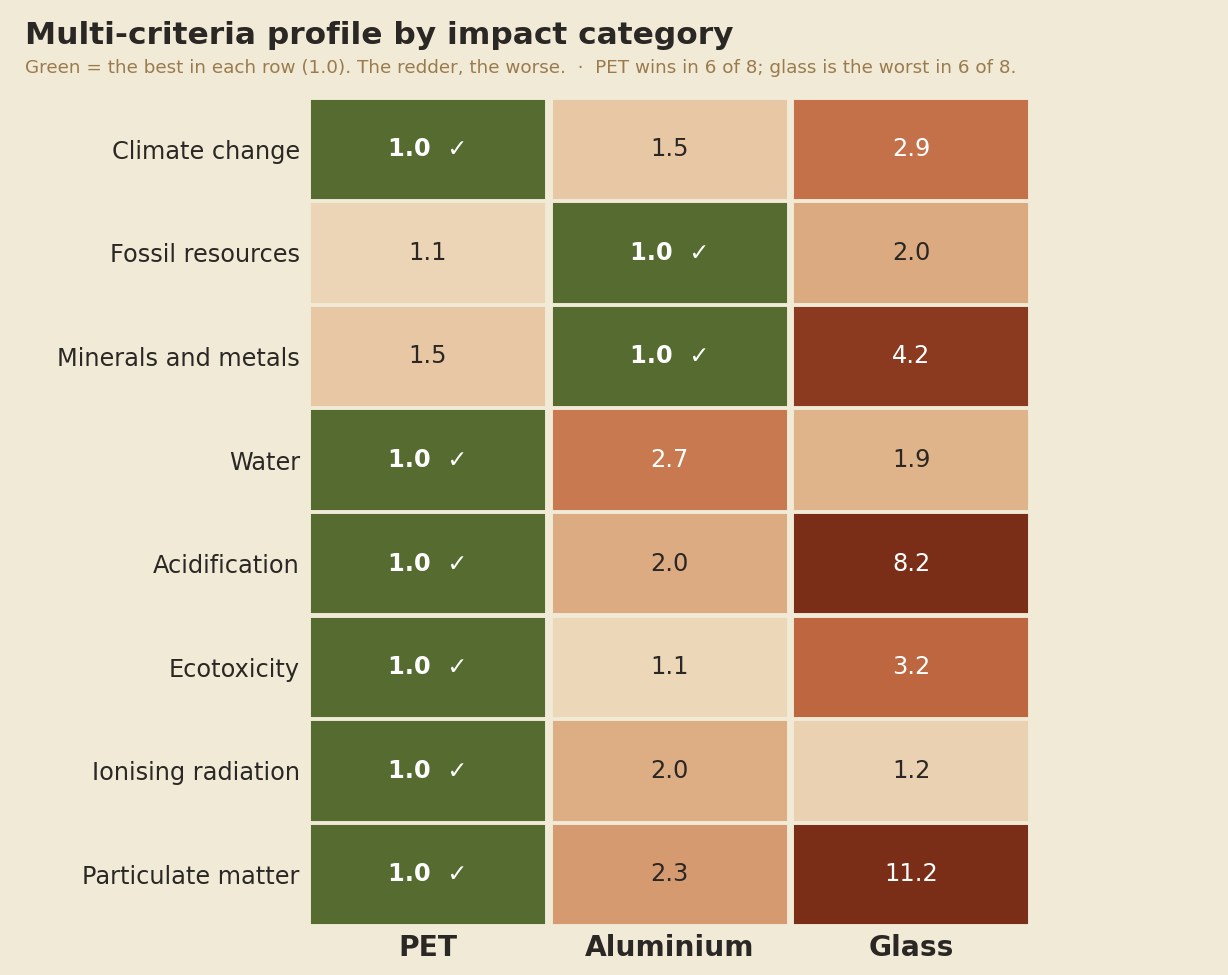
Across the 8 impact categories, PET wins in 6 and glass loses in 6. No cherry-picking: the order holds.
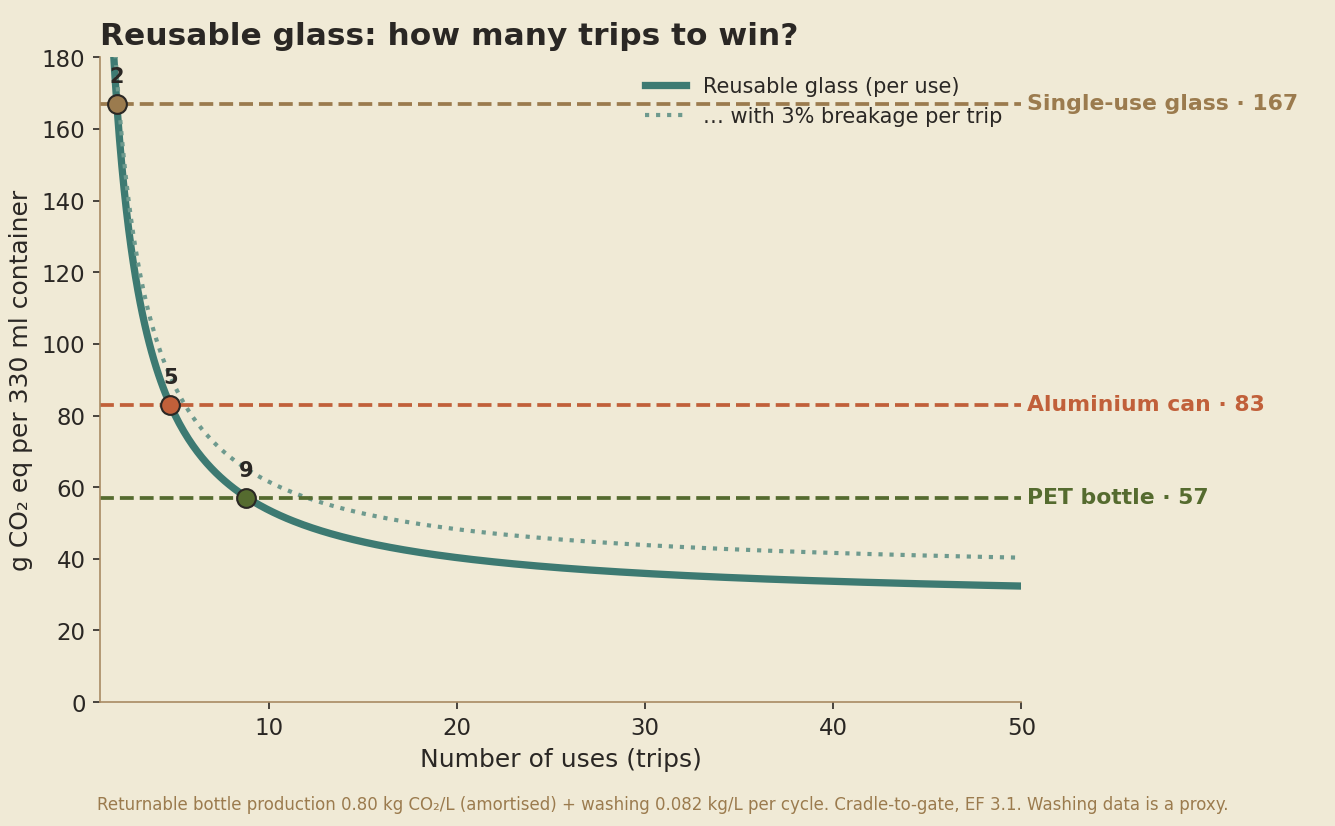
The very same glass, reused, goes from worst to best of all. The difference lies in the business model.
The same soft drink, in plastic, glass or a can. Which one weighs least in terms of manufacturing footprint? And above all: does that match what people believe?
Because intuition says "glass = natural = eco-friendly". The numbers say otherwise. Any drinks brand choosing its container, or wanting to communicate its sustainability, has this decision at stake. And from August 2026, European regulation starts asking for data to back it up.
This case doesn't answer with an "it depends". It answers with a number, a methodology in plain sight and the nuances a good analysis doesn't hide.
How it was doneA cradle-to-gate LCA: what it takes to produce the empty container, material and forming, excluding filling and distribution transport. The unit of comparison is not "one bottle" but packaging 1 litre of drink: that way we compare like with like, because it takes ~3 bottles of 330 ml to make a litre.
It was modelled in OpenLCA with the EF 3.1 method (the European Commission's Environmental Footprint) using public databases: BAFU-2026 for materials and European recyclers' profiles (EcoProfiles) to rebuild recycled PET. Three materials, same format, the same rule for all.
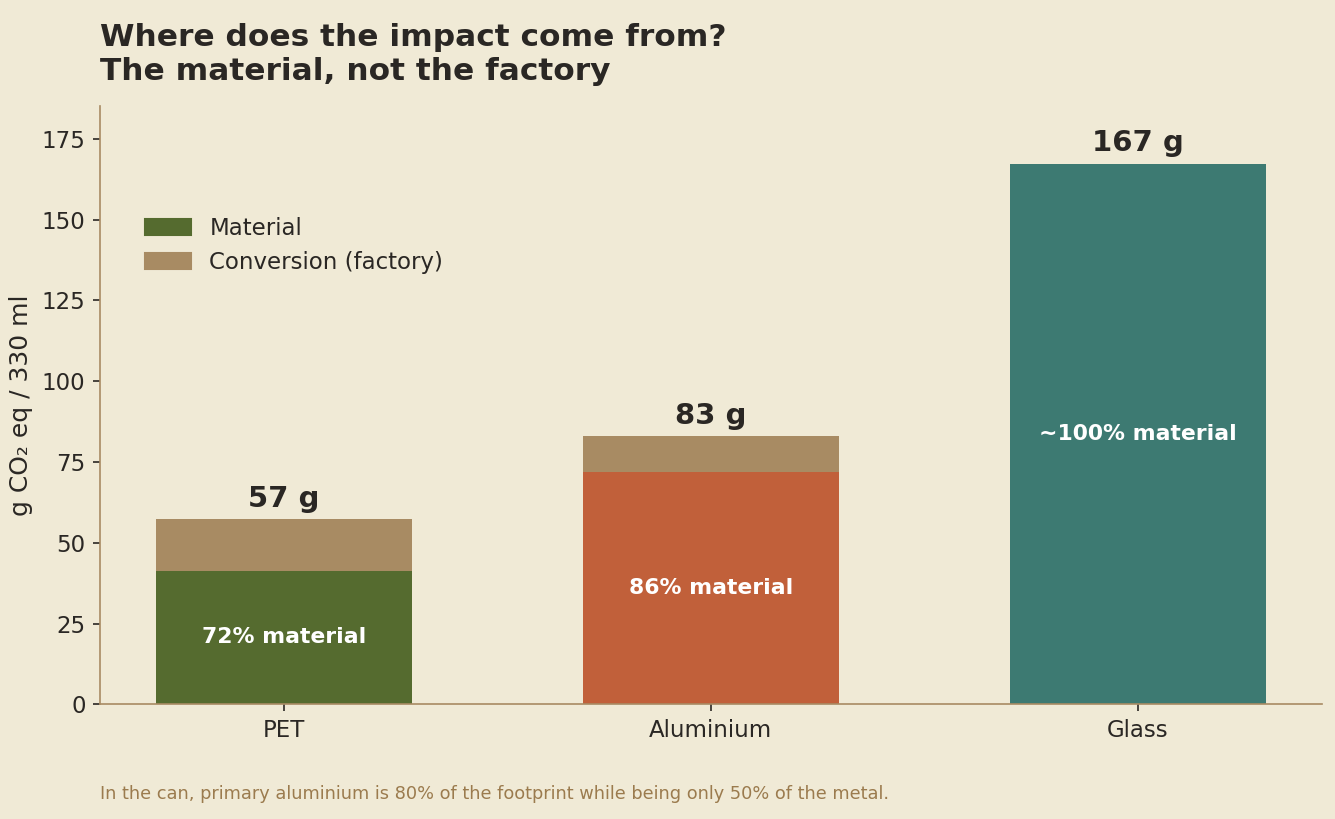
First finding, and the most useful for a manufacturer: for all three containers, the impact barely sits in the factory. It sits in the material. Blowing, rolling or drawing the container counts for little; producing the material accounts for almost everything. The extreme case is the can: primary aluminium is 80% of the footprint… while being only 50% of the metal.
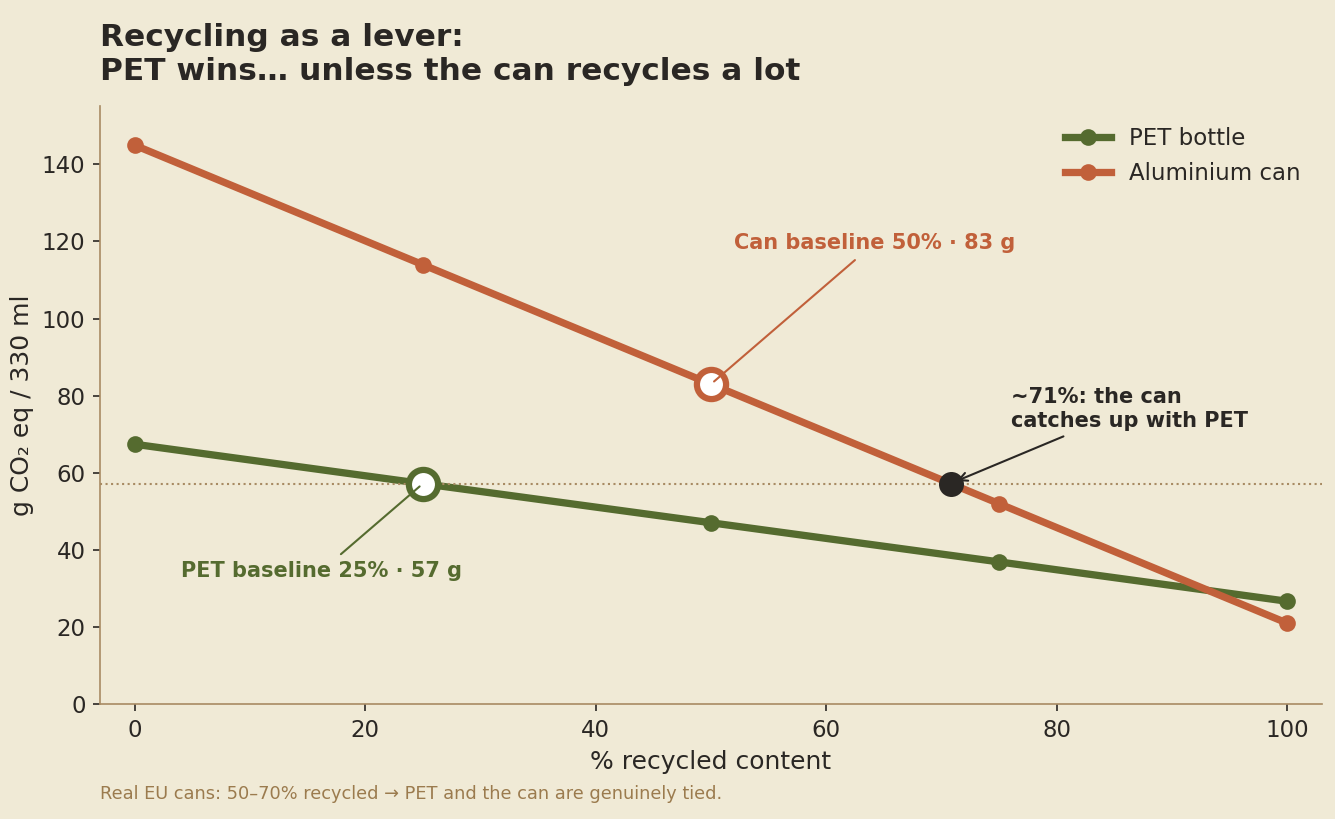
Increasing recycled content lowers the footprint almost proportionally. PET goes from 67 g (virgin) to 27 g (100% recycled). Aluminium moves even more, from 145 g to 21 g. At ~71% recycled content, the can matches PET, and real cans in the EU sit at around 50–70%. In practice, PET and the can are genuinely tied; which one wins depends on the actual recycled content of each.
The typical objection is "sure, but you're only looking at CO₂". I answer it with data: across the eight categories of the EF method, PET wins in 6 out of 8 and glass is the worst in 6 out of 8. Combining everything into a single normalised index, the order is clear-cut: PET 143 · Aluminium 184 · Glass 445. Glass triples PET here too.
Here's the good part. Single-use glass is the worst container (167 g). But reusable glass — collected, washed and refilled — becomes the best of all. It beats single-use glass at ~2 uses, the can at ~5 and PET at ~9. At 30 trips (normal in real returnable systems), it emits ~36 g per 330 ml, less than any single-use container.
| Container (330 ml) | Manufacturing (gate) | Multi-criteria index | With end-of-life recycling * |
|---|---|---|---|
| PET bottle · 25% rPET | 57 g | 143 | ~45 g |
| Aluminium can · 50% rec. | 83 g | 184 | ~58 g |
| Glass bottle · single use | 167 g | 445 | ~148 g |
| Reusable glass · 30 uses | ~36 g | — | — |
* End-of-life recycling is shown as a sensitivity (avoided-burden approach), not as a headline result. The glass ≫ PET ranking doesn't flip in any scenario.
If most of the impact is decided at the design table, in what order should you act? From greatest to smallest effect:
The dominant lever (returnable glass). Requires a collection and washing system.
The material decides almost everything; increasing recycled content cuts up to −60% in PET and is decisive in aluminium.
Going from 330 ml to 1 L saves footprint for free, purely through geometry.
Reducing weight. Real but limited: glass has room, PET and cans are already at the limit.
Where intuition says to invest first… and it hardly counts (10–15% conversion).
The container that "sounds eco" may be the worst. Measure before you communicate. If your volume allows it, a returnable system is the nuclear lever.
Your real lever is recycled content and weight, not plant efficiency. The PPWR is going to require both.
Ask for the footprint per litre delivered, not per container, and favour larger formats.
"Glass = sustainable" isn't supported by the numbers. Be careful claiming it: the Green Claims Directive cuts deep.
An indicative study using public databases (BAFU, EcoProfiles) and some declared proxies. It is not equivalent to an ISO 14040/44 certified LCA with a manufacturer's primary data: that's the next step, and it's done with a real client. A generic comparison with no brands: we don't attach figures to any named container.
PET bottles with 25% recycled content from 2025, and 30% from 2030.
Now applicable. Requires recyclability, minimum recycled content (from 2030) and, later on, the Digital Product Passport.
This case uses public data. Your product deserves its own: primary, verifiable, ready for your customer or your tender.