I took a kilo of almonds and grew it three ways — irrigated in California, rain-fed in Spain and irrigated in Spain — and measured its water in two different ways. Because in water accounting there are two schools with almost the same name that don't say the same thing. And something came out that no label tells you: with water, the metric is the message.
Water scarcity footprint (m³-eq/kg, ISO 14046 / AWARE) per 1 kg of kernels. Local irrigation quadruples the thirst of the imported almond.
The water footprint (WFN) counts litres; the ISO water scarcity footprint counts scarcity. For the same almond they produce opposite winners, and the metric that matters says the opposite of the viral litres headline.
In total litres, Spanish rain-fed almonds come to around 14,700 L/kg, almost three times California. Not because they drink more, but because they yield ten times less.
With the water scarcity footprint (ISO 14046), rain-fed drops to ≈0 and Spanish irrigated soars to 558: the "local" one is the thirstiest.
Each number, on its own, is correct. Showing only the one that flatters you, without saying which it is, is the first form of greenwashing.
The same almond, from irrigated California, rain-fed Spain or irrigated Spain. If you answer in litres, one wins; if you answer in scarcity (ISO 14046), another may win. Which one would you declare on your label, and which would you be keeping quiet?
It's not "how many litres go into an almond". It's what "water-sustainable" means, which metric really measures it, and how to communicate it without lying by omission when "local = less water" is an intuition the numbers dismantle.
How it was doneA cradle-to-farm-gate analysis of the same kilo of kernels from three real origins, modelled in OpenLCA. And measured with two yardsticks at once: the Water Footprint Network's volumetric water footprint (green rainwater + blue irrigation water + grey dilution water) and the water scarcity footprint from ISO 14046 (AWARE method), which multiplies blue water by how scarce water is in each basin.
Rain-fed orchards yield ~250 kg/ha versus California's 2,400. The same rainfall spread over ten times fewer kilos sends litres per kilo soaring. Counting litres penalises the most extensive crop — precisely the one that's kindest to the aquifer.
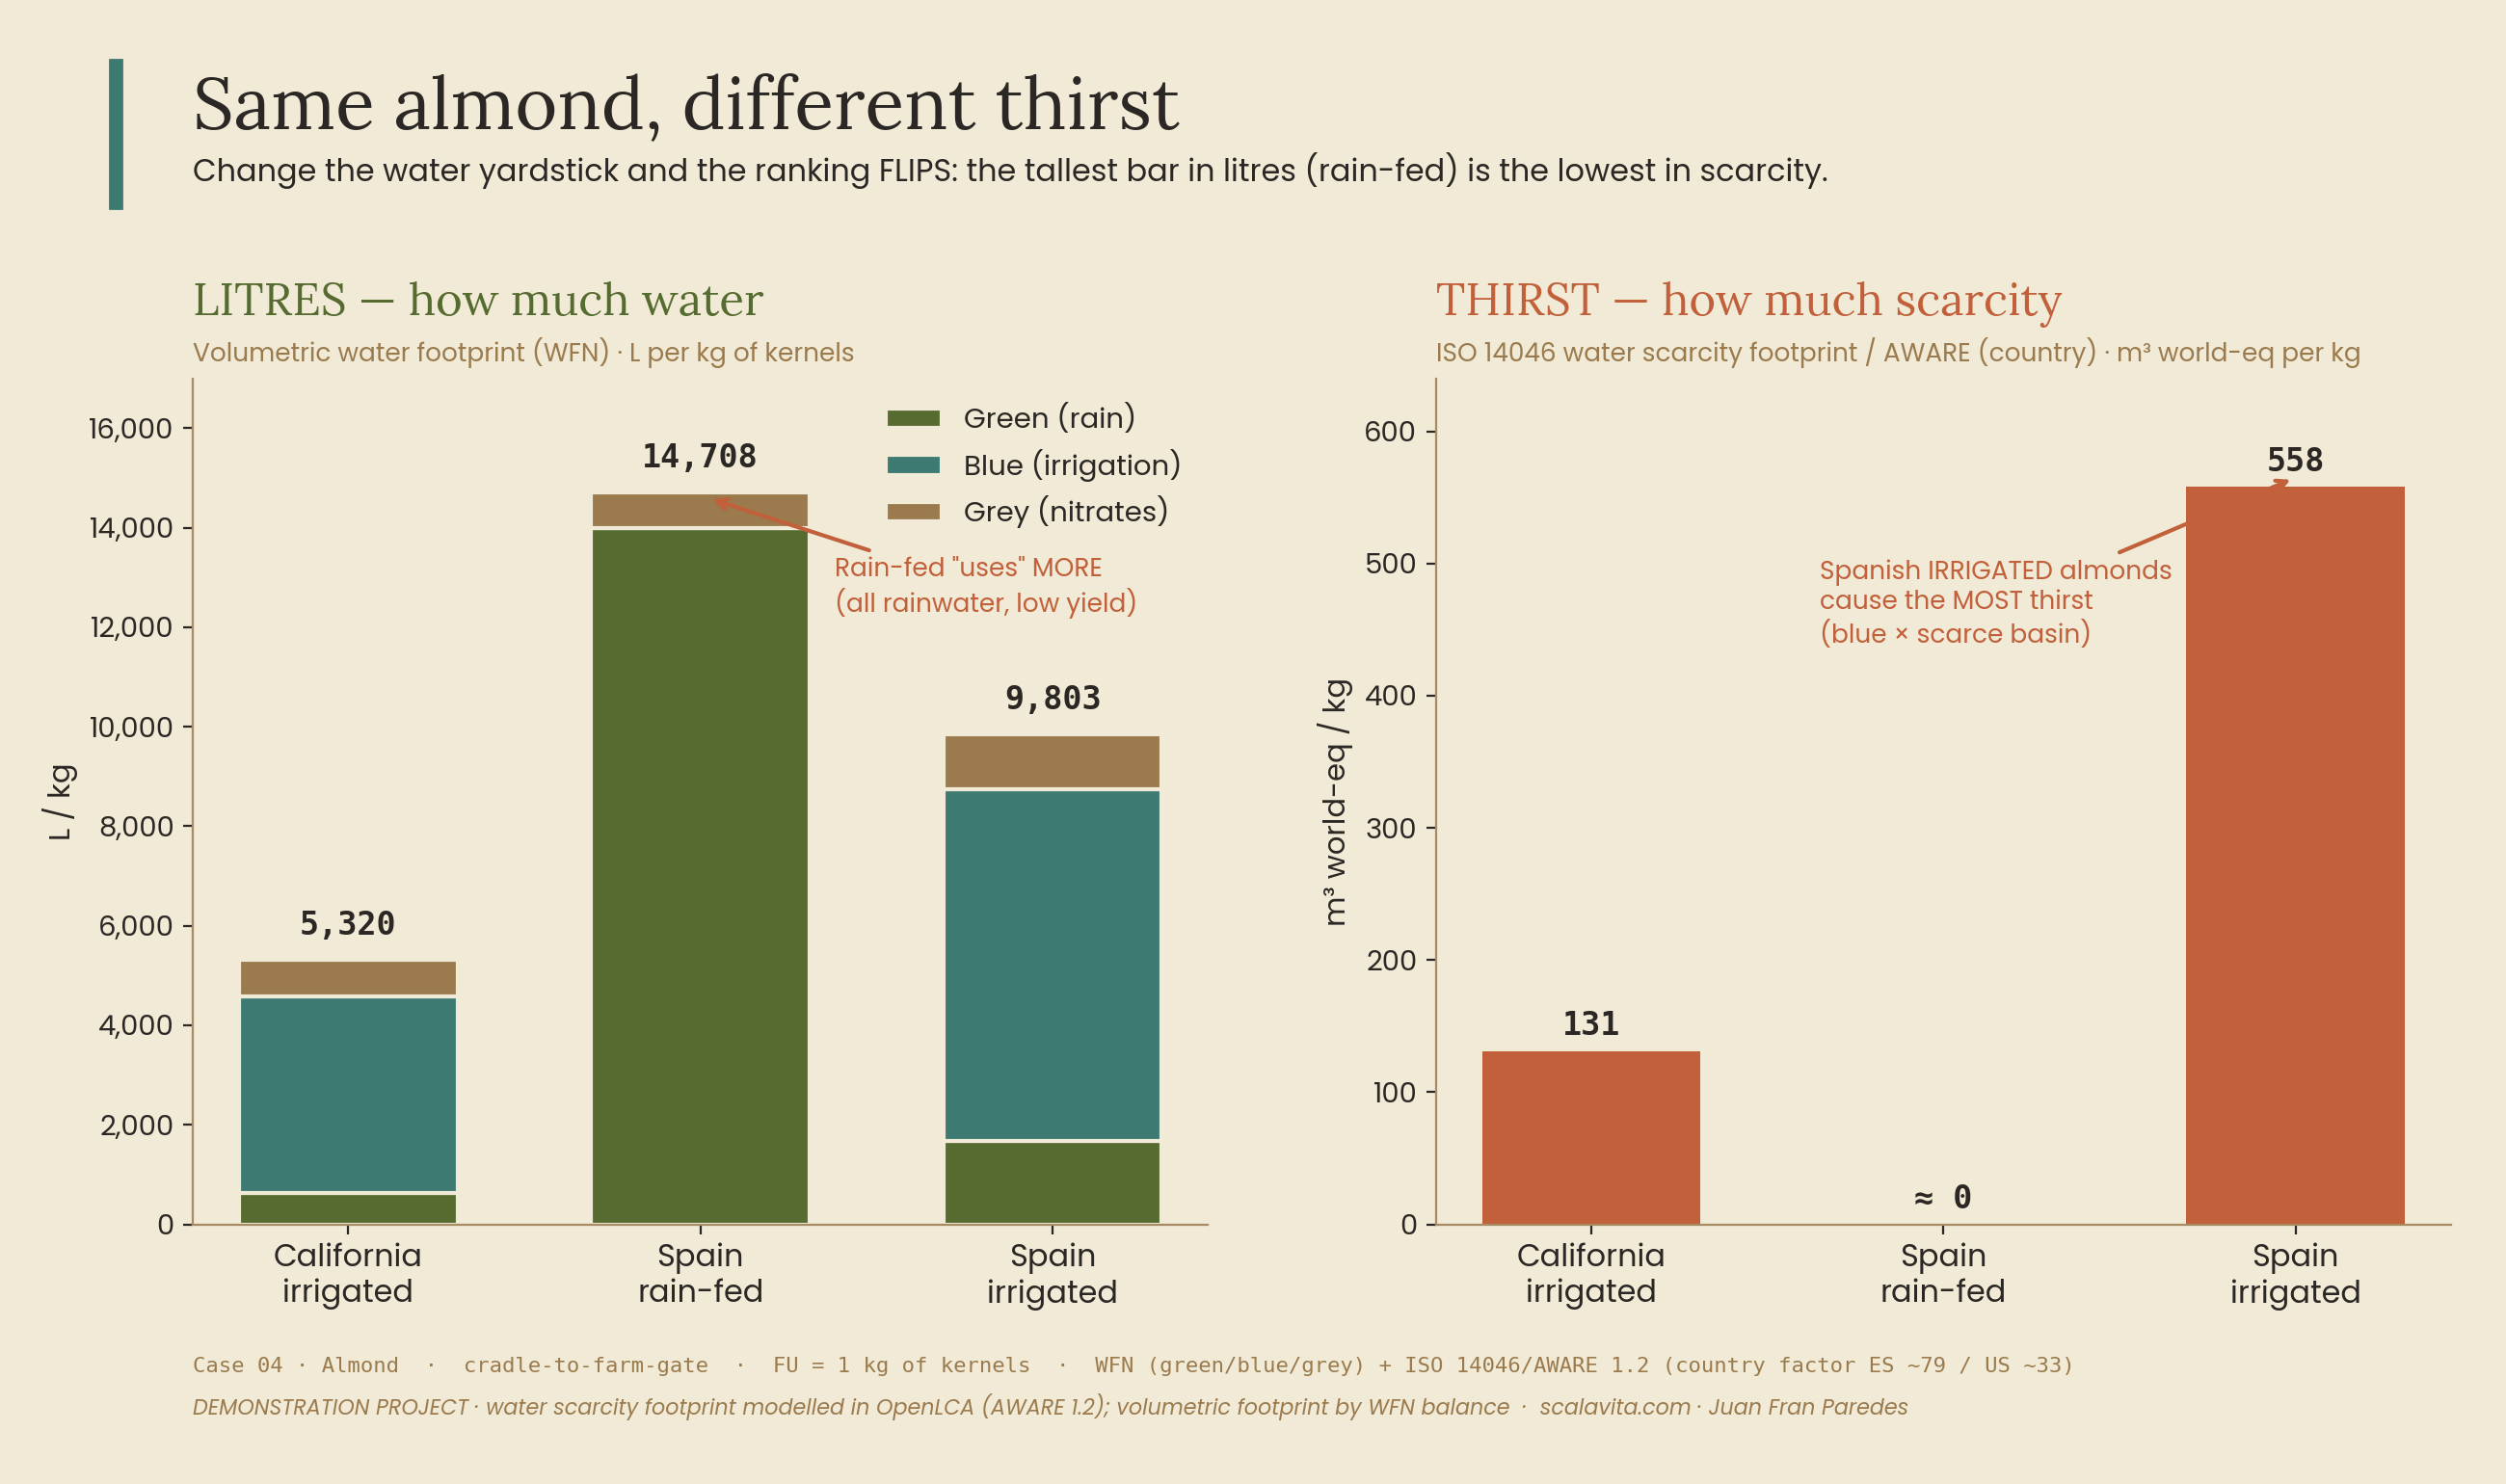
The water that truly competes with rivers, towns and ecosystems is blue water (irrigation); the rain (green water) would have fallen anyway. That's why, with the water scarcity footprint, rain-fed drops to ≈0 (it doesn't touch the aquifer) and Spanish irrigated soars to 558 m³-eq/kg, more than four times California's thirst (131). With zero food miles.
| Per kg of kernels | California irrigated | Spain rain-fed | Spain irrigated |
|---|---|---|---|
| Water footprint (L/kg, total) | 5,300 | 14,700 | 9,900 |
| Water scarcity footprint · thirst (m³-eq/kg) | 131 | ≈ 0 | 558 |
The same almond, two water metrics. Litres and thirst give opposite rankings: whatever wins on one loses on the other.
Two factors multiply in Spanish irrigated farming: it consumes more blue water per kilo than California (it yields less even when irrigated) and it draws it from a scarcer basin. The irrigation scarcity factor in Spain is 79; in the United States, 33. The same blue litre weighs more than twice as much in the Segura basin as in the Central Valley. Distance doesn't matter: what matters is where the water comes from.
And the viral figure, checked: in California, ~3.96 m³ of blue water across ~800 kernels comes to ~5 litres of irrigation per almond — the order of magnitude of the myth, confirmed. What the headline leaves out is that those litres, measured by scarcity, still weigh more than rain-fed's 14,700.
The water scarcity footprint is the right metric, but it's blind to two things: green water and land. Rain-fed hardly causes any thirst, true, but it uses ~40 m²·year of land per kilo, around ten times more than California (4.2 m²·year). It's not a free lunch: it's a trade-off. That's why this case reports both water footprints and land occupation. A single figure never tells the whole story.
Green and grey water are calculated by hand (Water Footprint Network method), because they aren't flows included in the LCA database; blue water and the scarcity footprint do come from the model. Pumping electricity is added separately: it affects the climate impact of irrigated farming, not water. An indicative study with public data, not a certified LCA with primary data from a farm.
Before putting "low water" on the label, be clear about which metric you're measuring it with. Scarcity (ISO 14046) is the one that stands up to an audit.
Your European customers are starting to ask for a water footprint. Measuring it properly, and by scarcity, is a commercial advantage, not just compliance.
Showing only the metric that flatters you is greenwashing by omission. State which one you use and why.
The lever isn't distance: it's irrigation efficiency and the basin. Rain-fed wins on thirst; it pays in land.
The EU's official environmental footprint method counts "water use" by scarcity (AWARE), not by litres. The footprint the EU recognises is precisely the one the viral headline doesn't count.
"Saves water" without saying which water (green/blue) or from which basin is exactly the kind of claim these rules are set to ban.
Companies in scope report water withdrawal and consumption with a focus on water-stressed areas: the scarcity metric, not litres.
European customers are starting to ask for it by basin. Measuring it properly — and by scarcity — is a commercial advantage, not just compliance.
This case uses public data. Your product deserves its own: primary, verifiable, with the right metric for your customer or your export market.